

Helping BID directors turn fragmented data into outreach plans
I led the design of an AI-assisted reporting workflow for a GIS and CRM platform, guiding users from raw neighborhood data to a decision-ready plan.
- Role
- UX/Product designer
- Company
- Ginkgo, GIS + CRM platform
- Timeline
- March – August 2025
Outcomes
Ginkgo is an app that integrates geographic information systems (GIS) with CRM, enriching neighborhood data and generating reports to guide decision-making for business improvement district (BID) staff.
I led the design of an AI-assisted reporting workflow to help BID directors turn fragmented data into actionable outreach plans, from research and framing through a prototype tested with users.
BID staff need to create actionable plans from reports
The app’s confusing UI/UX and lack of workflows present roadblocks.

What users had to do
- Jump between maps, reports, and external files
- Manually interpret results
- Translate report data into plans outside the app

App login, then no report guidance

- Fragmented entry points
BID staff didn’t know what to do after logging in.
- No intent framing
The workflow was limited to on/off settings.
- Data without synthesis
Report creation was confusing and basic.
Ginkgo surfaced data, but didn’t help BID directors plan outreach
BID directors could find maps, records, and reports across Ginkgo, but had to manually connect these pieces to form an outreach strategy. This created friction, slowed down decision-making, and limited the value users got from the platform.
- Data lived across maps, records, and reports with no unifying workflow
- Users had to export or manually synthesize information outside the product
- The app answered “what exists” but not “what should I do next”
BID directors are responsible for turning data into real-world action
BID directors are often under-resourced and time-constrained. They need tools that help them move from raw information to actionable plans, especially when coordinating across stakeholders, timelines, and neighborhoods.
- Plan and justify outreach efforts to boards, cities, and stakeholders
- Identify priority areas, trends, and risks quickly
- Translate complex data into clear recommendations and next steps
Proposed workflow
- 3 criteria questions
- 1 goal-based question
- 2 refinement questions
- AI insights and suggestions
- Raw data infographics
- AI query field
Login, then report setup immediately
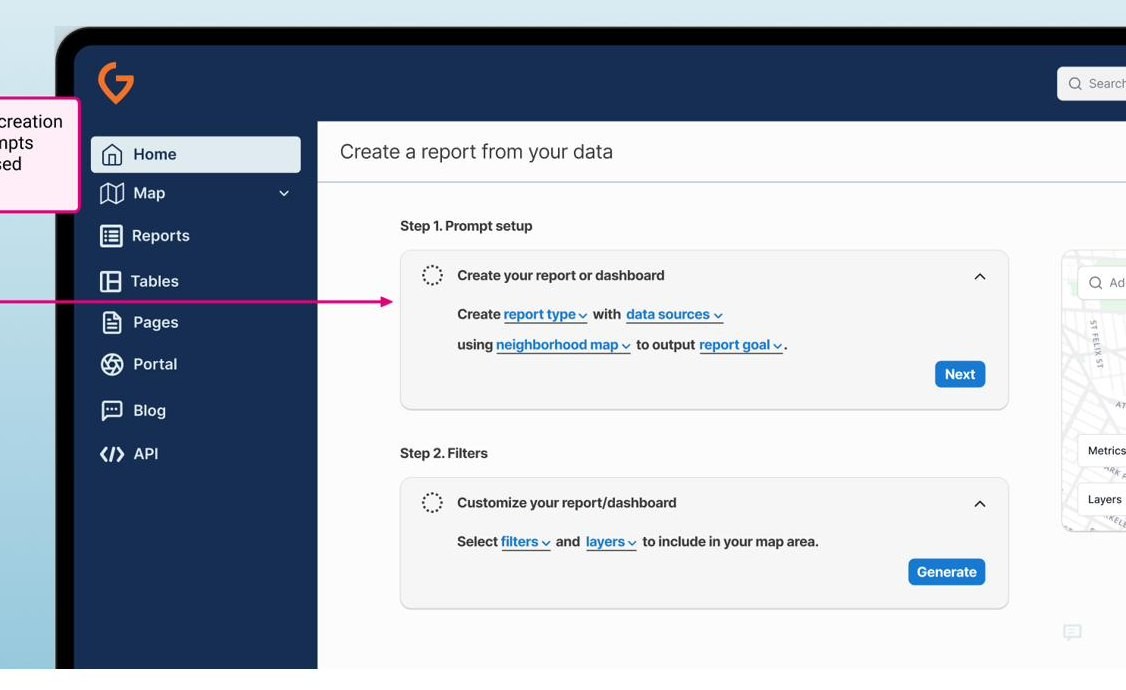
- Intent framing
Eliminated report-creation guesswork in favor of guided prompts with a defined report goal. Increased clarity and set up the AI insights.
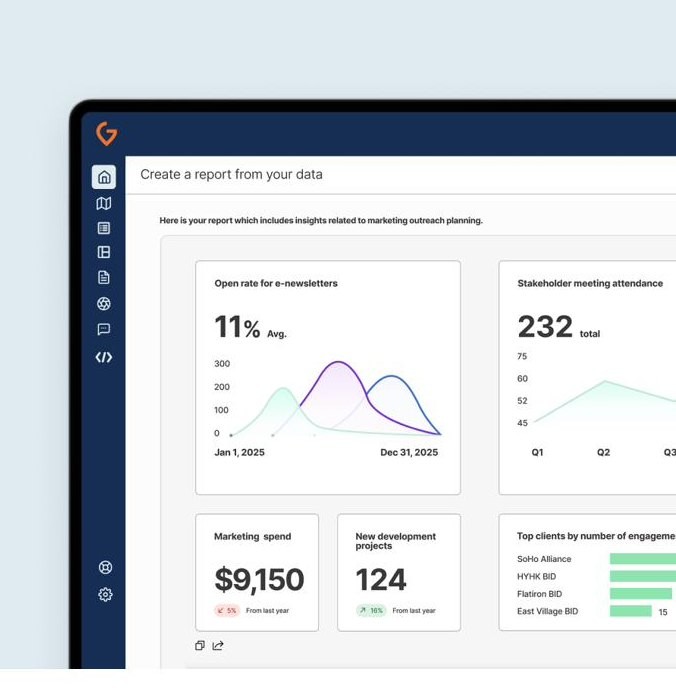
Report with AI integration

- AI-assisted report
Raw data output enriched with AI insights above it, and a query field below.
From guided setup to a regenerable report

- Report setup
A Mad Lib style prompt guides users through previously complicated menus (screens 1–4).
- Report output
AI integration lets output and insights be regenerated on the fly (screen 5).
Prompt setup: open prompt versus guided sentence
Free-form text input didn’t seem like it would solve user needs or improve the UX as much as inputs within a Mad Lib style prompt.

Split-page report + AI versus full-page report + AI

OK, but less direct.
Stronger connections to the raw data.
Engineering constraints shaped how the solution could be delivered
The concept required restructuring report creation and layering AI into the output, but major architectural changes weren’t possible. So the design strategy had to work within existing systems while still creating enough customer value to justify a premium tier.
- Engineering bandwidth was limited for custom development
- The Omni reporting plugin defined how reporting could be extended
- Extended functionality within Omni instead of replacing it
- Leveraged AI APIs to deliver insights without altering core architecture
- Positioned AI-assisted reporting as a premium feature to support integration costs
User interviews revealed distinct needs based on experience level
I interviewed users about their work roles, tasks, and app needs, along with a Q&A about my prototype. This surfaced two usage patterns: newer users who needed structure to get started, and experienced users who wanted fast, flexible control. This informed how workflow guidance and AI capabilities were positioned within the product.
- Newer users valued guided workflows that reduced ambiguity
- Experienced users preferred fast access and selective AI usage
- Validation supported guided setup for onboarding and AI synthesis for power users
Guided setup and AI each contributed value
Interviews revealed that structured prompts helped users articulate what they wanted to analyze, while AI-generated insights accelerated synthesis and decision-making. Together, these patterns supported offering guided workflows as core value and AI-powered reporting as a premium capability.
- Guided Mad Lib setup helped users frame intent and reduced setup ambiguity
- AI-driven reports provided the most value by synthesizing raw data into insights
- Validated positioning AI reporting as a premium tier due to its differentiated impact
The prototype delivered core functionality and validated the business direction
The prototype enabled structured report creation and layering of AI insights in a way that worked within technical constraints. This allowed testing of real user workflows, evaluation of pricing strategy, and a foundation for future product expansion.
- Introduced AI-assisted reporting to generate insights alongside raw data
- Confirmed that AI features supported a premium-tier pricing model
The solution improved user workflows and differentiated the product
The updated reporting experience reduced friction for new users, accelerated decision-making for experienced ones, and positioned Ginkgo as more than a data repository. These improvements strengthened user perception and created strategic room for premium features.
- Guided workflows clarified how to create reports and reduced setup confusion
- AI-assisted output enabled faster synthesis and reporting compared to manual methods
- Strategic differentiation moved the platform toward insight-driven decision support